Dashboard
Your Dashboard serves as a central hub for monitoring your workspace. It gives you a complete overview of your usage, providing detailed reports on credit consumption and processed documents. In addition to these metrics, you can also view a list of all your business apps, allowing you to quickly navigate to and manage them.
Reports
These reports provide a comprehensive overview of your platform's usage, broken down into three main categories:
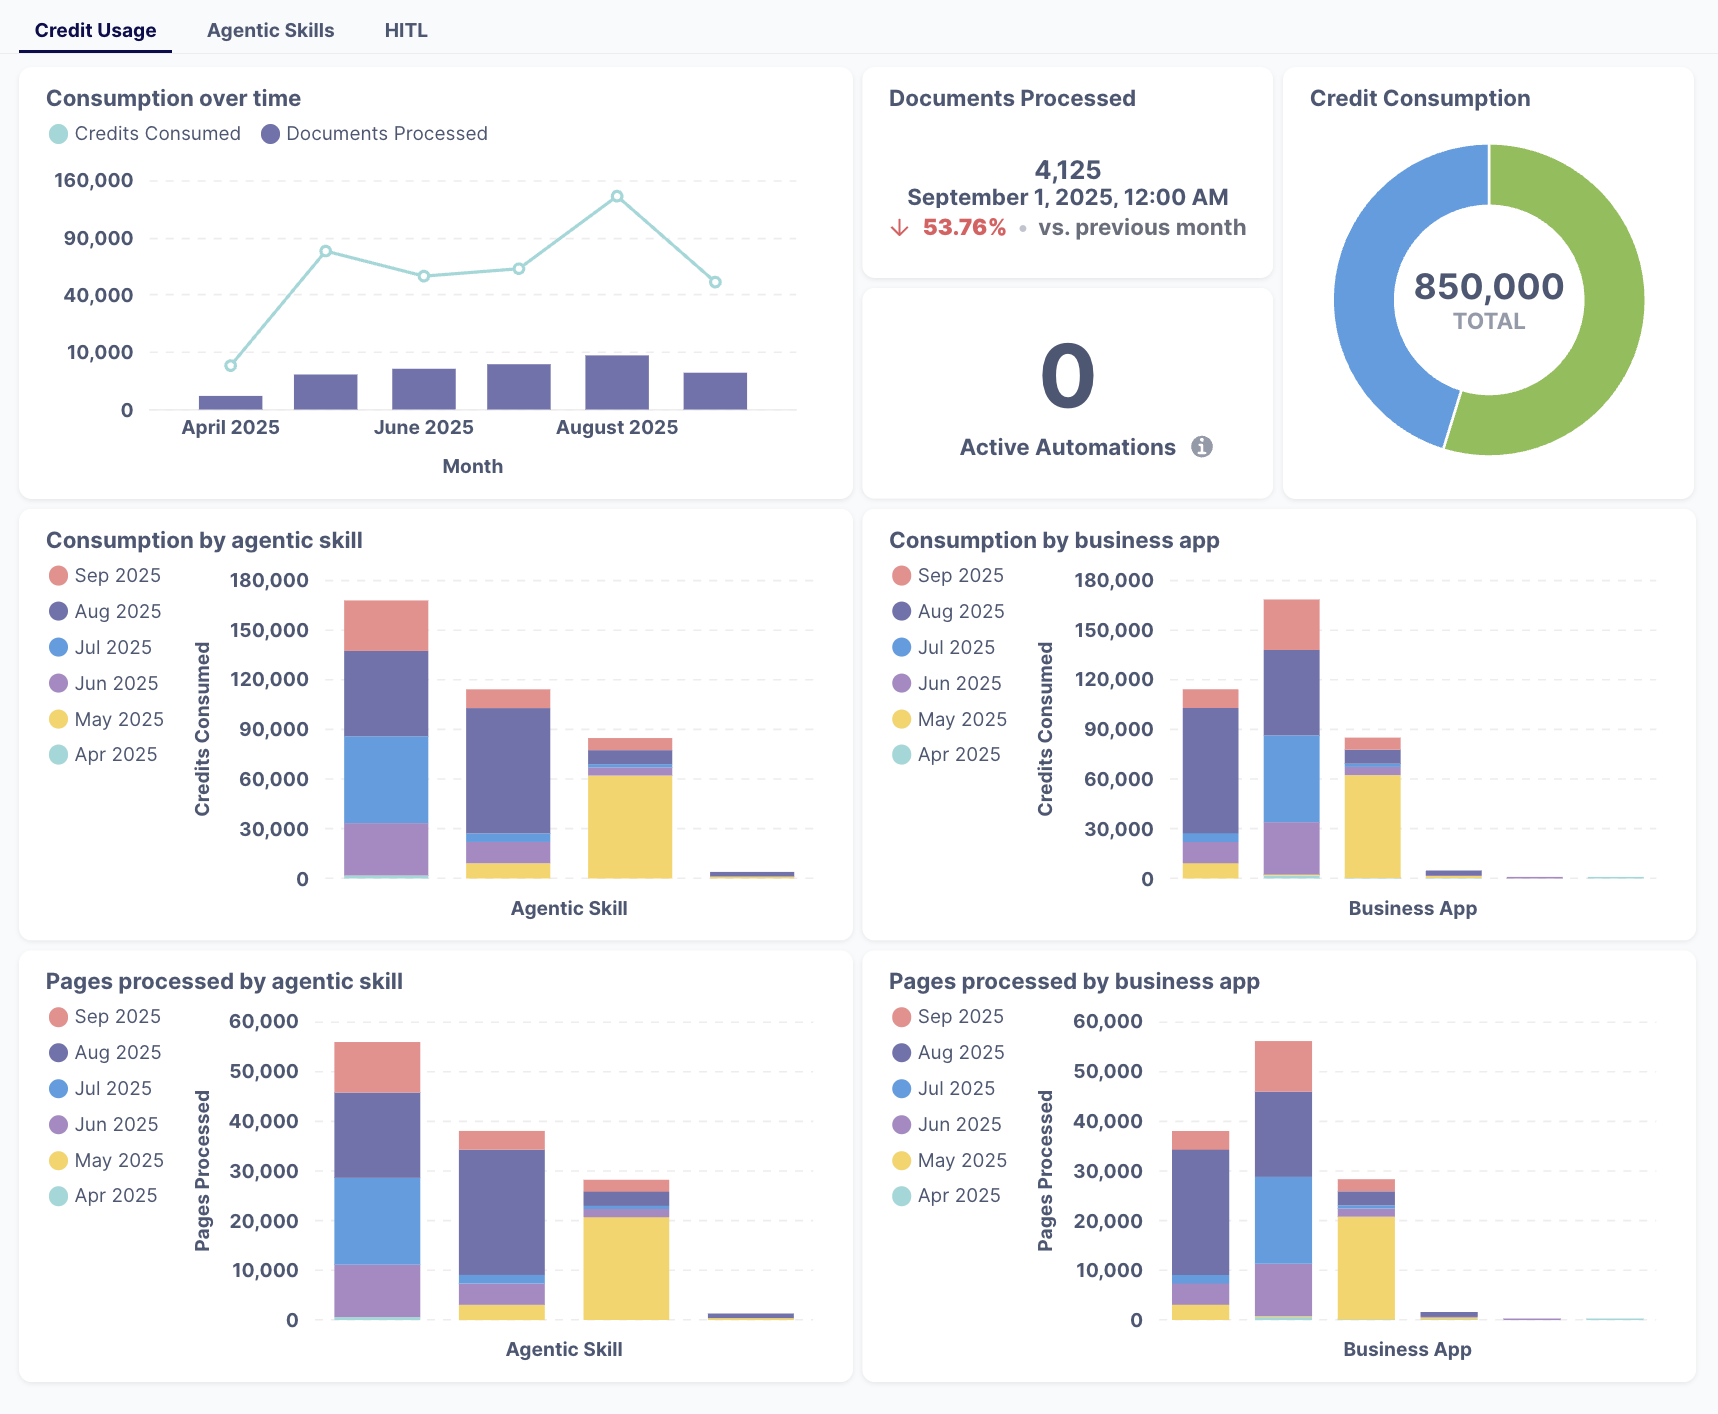
Credit Usage
This section gives you detailed statistics on resource usage, including a look at credit consumption over time, the total number of documents and pages processed, and how this compares to previous months. The reports also show a breakdown of consumption by specific agentic skills and business apps, allowing you to see which automations are using the most resources.
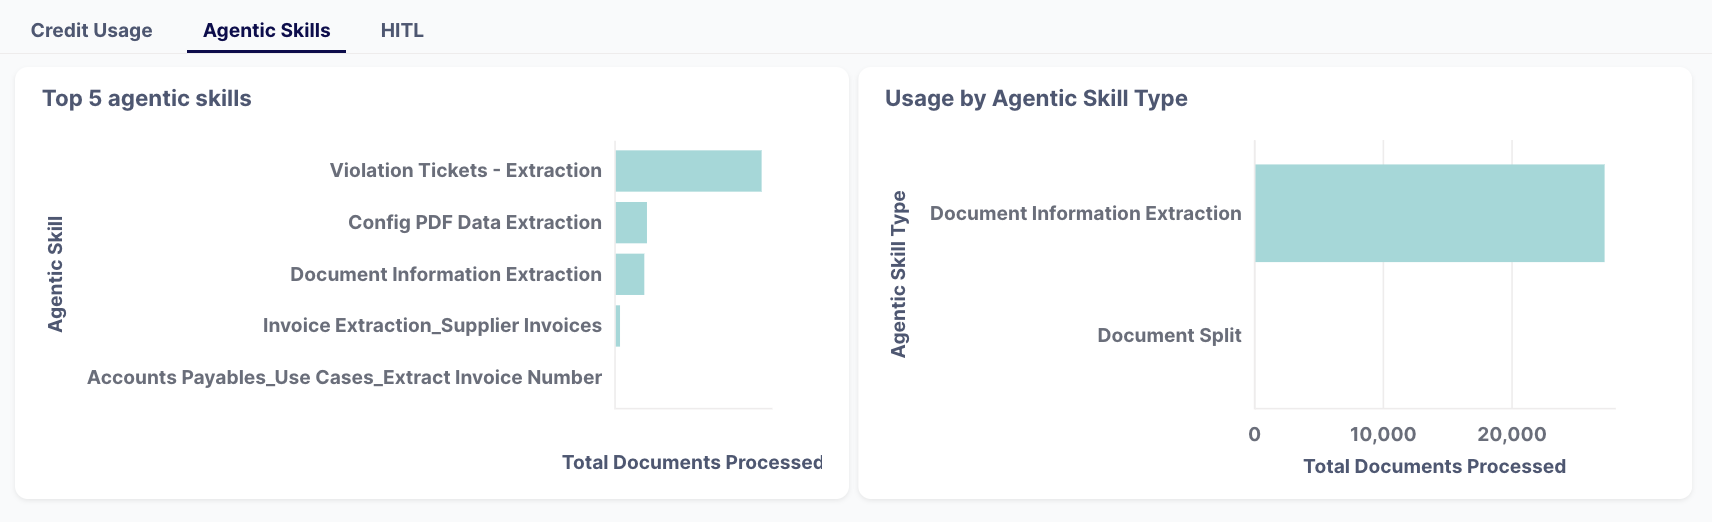
Agentic Skills
The graphics provide insights into your top-performing skills by showing you the top 5 most-used agentic skills and breaking down their usage by skill type.
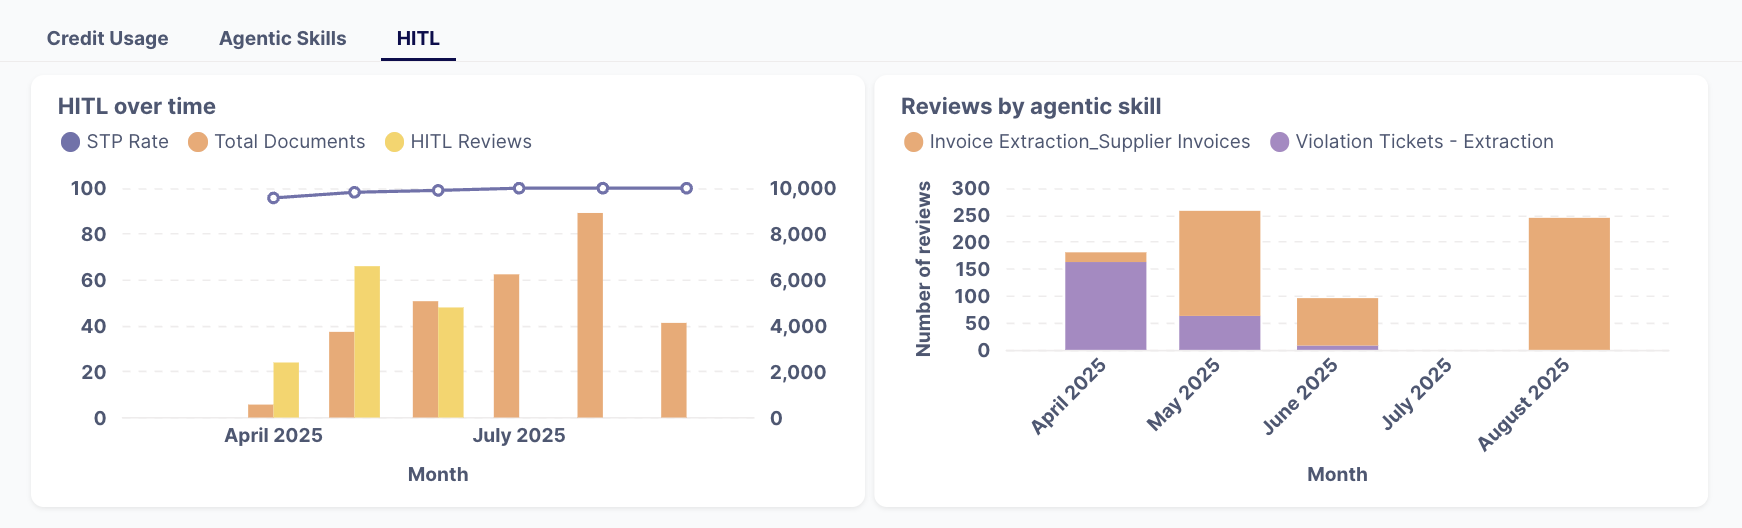
Human-in-the-Loop (HITL) Metrics
This area provides statistics on human intervention, including how many reviews have been completed over time and a breakdown of reviews by individual agentic skills.
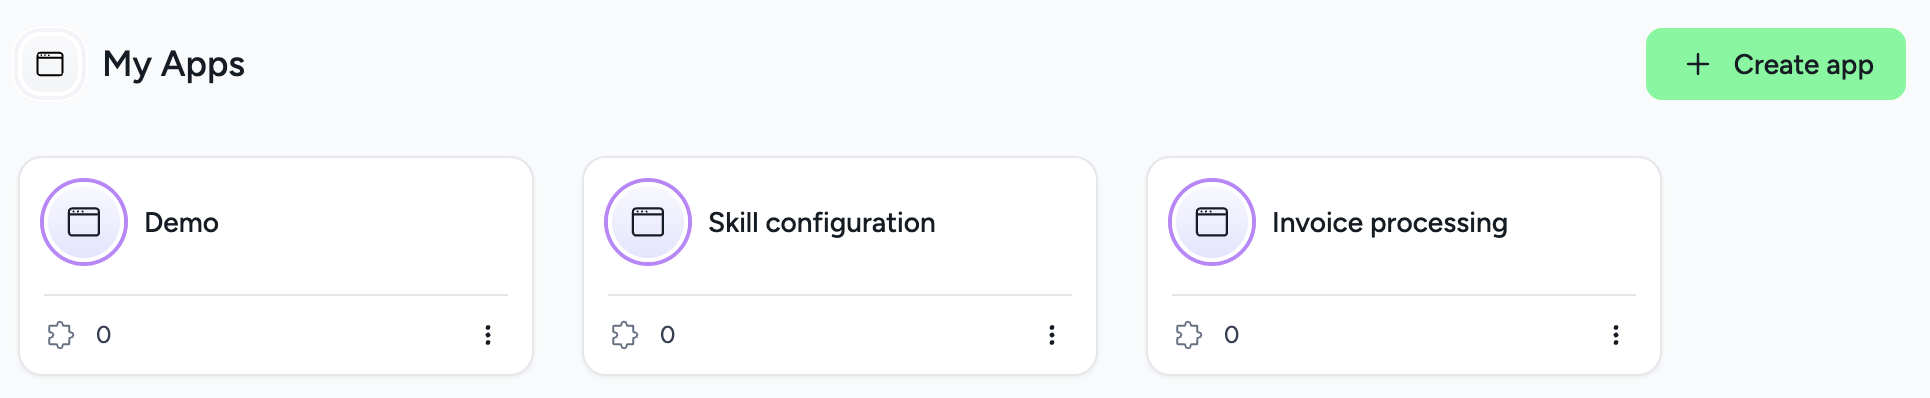
My apps
Your dashboard also provides a list of all your Business Apps within the selected Workspace. From this list, you can quickly access each individual app to manage its associated flows, skills, and settings.